If your Dr sais your blood test are normal yet you’re experiencing frustrating symptoms, question them, respectfully.
Why to be sceptical of reference ranges and look deeper?
When a lab is setting up a new blood test, they can use the manufacturer’s range based on..
1) Reagents provided (pre-made solutions)
2) Published reference ranges
3) Locally established reference ranges as the baseline.
They then confirm these reference ranges using a minimum sample population of 20-25 patient samples to confirm that these reference ranges correspond to the local population that the testing laboratory will be conducting this blood test on.
Limitation #1: We live in a very heterogeneous society, particularly in major Australian cities, thus the ranges can be skewed to a demographic that you may not be (minority populations and mixed ethnicity)
Limitation #2: Unhealthy user bias. This is where unhealthy people are typically biased to perform a certain behaviour (e.g. go to the Doctor and get their blood tested).
This attracts sicker more unhealthy people to get their blood tested, thus the sample that confirms these ranges can be confounded.
There are comparatively very few healthy patients who are just curious to check their bloods and will be a part of this sample.
This skews the data towards a reference range that represents poorer health.
If there are no published reference ranges, a population of ~120 patient samples are required from the local ‘healthy’ population.
Basic statistics are then applied and the 95% percentile is then used to establish the normal population.
Limitation #3: It is important to note that this means that 5% of the population will fall outside of this normal reference range.
Strength #1: This is good because they will control for major risk factors such as smoking, obesity and disease.
However, we all observe that the average ‘healthy’ population can often be unhealthy in many ways (overfat, GI issues, micronutrient deficiencies, poor mental health, low exercise frequency).
This again skews the data in a way that you may not like to be compared against.
The Ideal World
In an ideal world, reference ranges would be sub-categorised based on different levels of health status, lean body mass, strength levels and overall wellbeing. This would allow the patient and Doctor to negotiate on who they should be compared against.
An overweight 50 year old with diabetes probably doesn’t need to be compared to a 25 year old athlete.
Yet the reference ranges are based on both these people.
An alternative solution would be comparing the 50-year-old to a healthier standard deviation. Then you would aim to slowly move him to the ideal health status one standard deviation at a time.
On the other hand, the athlete who wants to improve and maintain would be compared to his respective cohort, not to the average ‘healthy’ population which is not who he aspires to be.
The Solution
Now, this obviously doesn’t exist in traditional medicine, but it does exist!
Where?
In the hands of health professionals who…
- Spends time reading modern literature to stay up to date on what is ideal and optimal.
- They align with the value that being average is not ideal.
- They have the value and skillset to maximise the health, wellness and performance of their clients.
- Publically and privately admit when they’re wrong and have learnt something new.
- Is not emotional or dogmatic about views towards certain health behaviours.
- Can argue the opposite perspective to their own belief.
These are traits of a coach, health professional or Doctor you want to look for if you want to be more than average.
Have healthy scepticism and look deeper into your health with someone who understands that you need to comprehensively look at the entire human.
Diving Deeper Into Reference Ranges
Location
The way that reference ranges are determined also needs to be kept in mind when travelling around different hospitals or clinics that use different pathology providers – reference ranges might be similar amongst testing laboratories but there will be some subtle differences. There are also different testing methods used which may affect the reference ranges.
Example: Mean Cell Volume (MCV)
The mean cell volume, or MCV, is a red blood cell indices that measures the average volume of a red blood cell.
Values obtained outside the normal range can be indicative of thalassemia, anaemia, vitamin deficiency, or alcoholism. Depending on the testing lab, the reference range may be:
- 79 – 93 fL (http://perinatology.com/Reference/Reference%20Ranges/Mean%20corpuscular%20volume.htm)
- 80 – 96 fL (https://emedicine.medscape.com/article/2085770-overview)
- 80 – 100 fL (https://www.mydr.com.au/tests-investigations/full-blood-count-fbc)
If you’re moving areas be considerate that your reference range may be different to your new location.
Practical Examples: TSH & PSA
In practice, there are no rigid limits demarcating the diseased population from the healthy.
The normal reference range for TSH is 0.4 – 4.0 mU/L.
However, if a patient presents with a result of 4.05, you wouldn’t immediately scream ‘hypothyroidism’.
You would take the result in light of the clinical picture you have developed by looking at all the other symptoms a patient presents with and then make an informed decision.
Furthermore, you would acknowledge that most clinical symptoms, modern data and clinicians will generally agree that TSH >2.0 is often problematic, particularly for females trying to conceive.
In practice, there is quite a bit of overlap in values between normal and diseased pathology results.
The prostate-specific antigen (PSA) is an example of this:
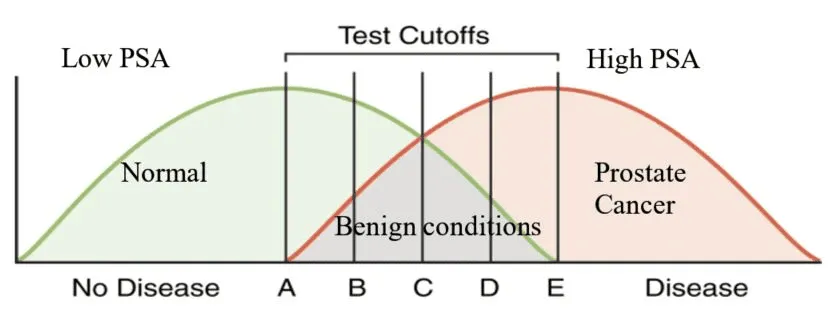
This is the scenario that we are frequently left with. If we have a cutoff at E, we pick up everyone with the disease – everyone is a true positive. But we’re also missing a lot of patients whose results may be lower and fall into the normal reference range.
Move it to C, we get more true positives, but we’re also getting a number of false positives.
If we move the cutoff to A, we pick up everyone with prostate cancer. We also pick up nodular hyperplasia and prostatitis and those patients have to undergo a biopsy, but it’s better to pick up all patients with cancer than miss a few and have to provide palliative care later when the disease is too advanced.
This is wonderfully objective and contextual. I don’t know if Doctors < the 2010s were taught this type of mentality, but modern Doctors coming up now I am excited about.
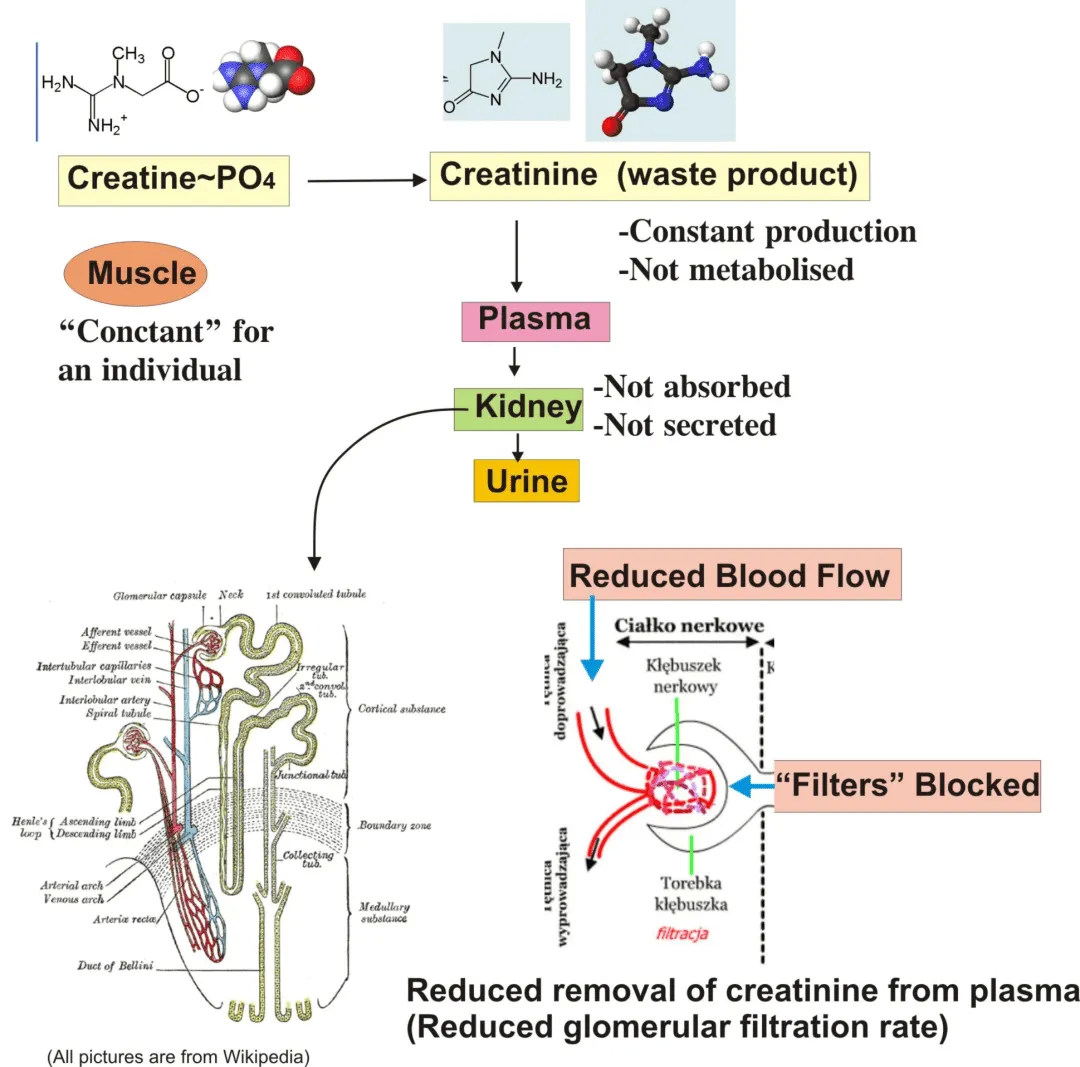
Practical Example: Creatinine
Creatinine is a waste product produced by muscle and it is produced at a fairly constant level.
It is not absorbed or secreted and must be excreted by the kidney.
A high level in the blood could indicate kidney dysfunction.
 I often see this along with Urea high in my clients because almost all of them consistently weight train 3-5x p/w and consume a high protein diet.
The context of this lends itself to a different interpretation.
Creatinine Reference Ranges
Male: 60 – 120 umol/L
Female: 45 – 90 umol/L
7 – 11-year-olds: 29 – 65 umol/L
If an asymptomatic young female patient presents with a creatinine of 130 umol/L, this could mean she has renal disease…BUT…there are clear issues with this assumption.

Morjorie started bodybuilding at the age of 72. This picture was taken when she was 86.
If she turned up to your clinic in a T-shirt or jumper, your assumption would be that she is your typical geriatric patient.
A creatinine result of 130 umol/L would start you organising immediate treatment for kidney dysfunction.
However, because she works out frequently, this would be a normal result for her.
While she is an outlier, this result would be normal for many females who weight train consistently (they are not outliers).
Blood Test Confounding Factors
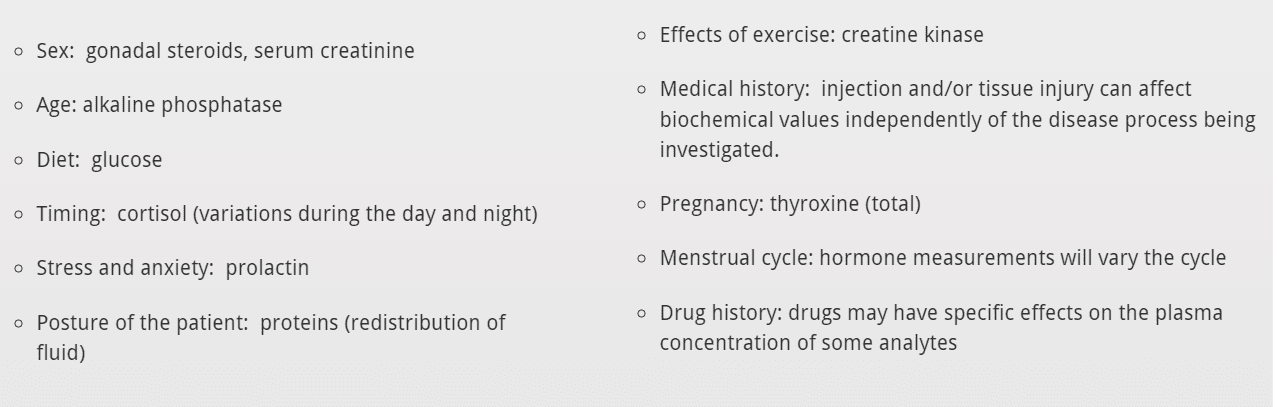
The Mistake Of Looking At One Blood Test
Reference ranges are only a guide and you need to compare these results to previous results.
Thus we want to look at TRENDS over time not solely rely on snapshots of moments in time.
If a result does not fit with the clinical picture you have come up with based on symptoms and the clinical picture, repeat the test with a fresh sample.
There can be several reasons for an unexplained result. This could be because of:
- Pre-analytical, occurring outside the laboratory, e.g. the wrong specimen being collected, mislabelling, incorrect preservation, etc.
- Analytical, occurring within the laboratory, e.g. human or instrumental error: precision/accuracy; lipaemia; haemolysis.
- Post-analytical, whereby a correct result is generated but is incorrectly recorded in the patient’s record, e.g. because of a transcription error.
Most Doctors coming up in the last 5-10 years are taught that just because the patient’s result falls into the acceptable reference range, this may be an abnormal result for them.
But there are many old school traditionally minded Doctors who unfortunately haven’t stayed up to date on the changes and advances in thinking and science.
Please be patient and empathetic with them, some people are just stuck in the mud and don’t even know it.
For more education on maximising health, wellness and performance follow me on Instagram, Facebook & YouTube or see my coaching services here to get into the best health of your life.
P.S. Please note this is how Australian health practitioners are taught this may not representative of other countries.